
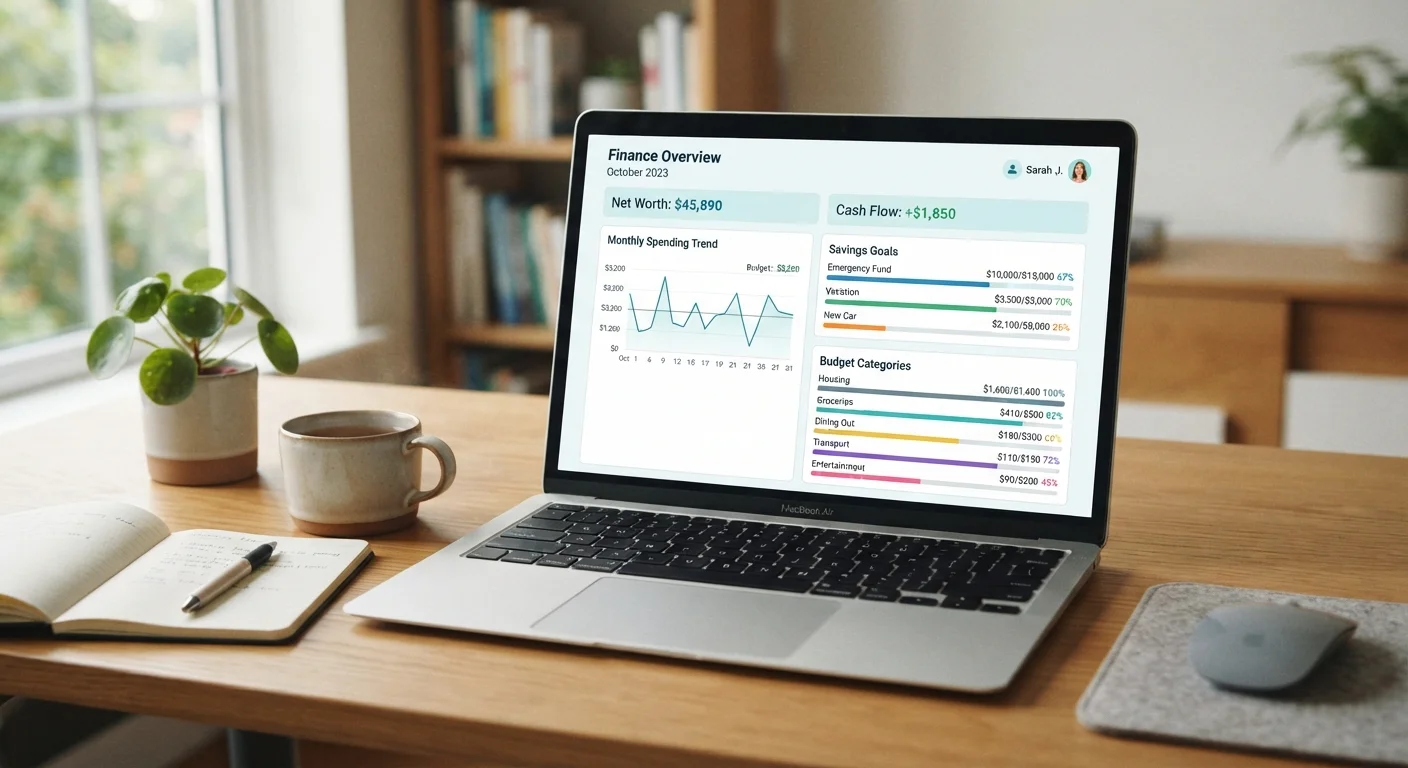
What a Personal Financial Dashboard Actually Is
A personal financial dashboard is simply a single place where you can see your most important money numbers at a glance. Think of it like the instrument panel in a car - you don't need to understand every wire behind the dashboard to use it effectively. You just need to know what the key readings mean and what to do when something looks off.
For beginners, the biggest benefit is clarity. When your financial information is scattered across bank apps, credit card portals, and paper statements, it's easy to feel like you have no idea where you stand. A dashboard pulls those numbers together so you can see your full picture in one view.
If you're still building the habit of tracking money at all, start with our complete beginner's budgeting foundation before building a dashboard - the two work hand in hand.
Net worth
The total value of everything you own minus everything you owe. It's the single most useful number for tracking your overall financial progress over time.
Savings rate
The percentage of your income that you keep rather than spend. A higher savings rate generally means faster progress toward financial goals.
Baseline
Your starting-point numbers when you first set up a tracking system. Having a baseline lets you measure how much things have changed over time.
Debt balance
The total amount you currently owe across all loans and credit cards. Watching this number decline over time is one of the clearest signs of financial progress.
Discretionary spending
Money spent on non-essential items - entertainment, dining out, hobbies. These are often the most flexible category in a budget.
The Five Core Data Points to Include
You don't need dozens of metrics. These five categories give beginners a complete, actionable snapshot:
- Monthly income (after tax): The actual amount that lands in your account each month. This is your starting point for every other calculation.
- Monthly spending by category: Group your expenses into four to six categories - housing, food, transport, subscriptions, and discretionary spending are a solid set. Total them up monthly.
- Net savings rate: The percentage of your income you're keeping rather than spending. Even 5-10% is a meaningful start. The formula:
(Income - Spending) ÷ Income × 100. - Total debt balance: The combined outstanding balances of any loans, credit cards, or other debts. Track this number monthly to confirm it's moving in the right direction.
- Net worth: What you own (savings, investments, property value) minus what you owe (all debts). This single number, tracked over time, tells the story of your financial progress.
For practical guidance on turning spending categories into a working monthly plan, see our first monthly budget walkthrough.
How to Set Up Your Dashboard From Scratch
Setting up your dashboard takes about an hour the first time. Here's a straightforward approach:
- Choose your format. A spreadsheet with five columns - one per data category - works well. Free tools are available through most major platforms. A printed table in a notebook is also perfectly valid.
- Gather your starting numbers. Log into your bank accounts, loan servicers, and any investment accounts. Write down current balances. This is your baseline - your Month 0.
- Set up monthly rows. Create a new row for each month. At the end of each month, spend 15-20 minutes filling it in with updated figures.
- Add a simple chart. Even a basic line chart of your net worth over time is powerful. Seeing a line trend upward - even slowly - is motivating in a way raw numbers aren't.
- Link it to your goals. Note your target next to each metric. For example: savings rate goal of 15%, debt payoff target of $8,000. This turns the dashboard from a record into a roadmap.
For broader context on how a dashboard fits into your overall money plan, the end-to-end financial planning guide walks through every stage from goals to ongoing review.
Using Your Dashboard to Make Better Decisions
A dashboard only creates value when you actually use it to guide choices. Here's how to make that happen:
- Monthly review habit: Set a recurring calendar reminder. Fifteen minutes once a month is enough to update your numbers and ask: Is my savings rate improving? Is debt declining? Is net worth growing?
- Spot trends, not just snapshots: A single month's data tells you little. Three to six months of data shows a pattern. If spending in one category consistently overshoots, that's a signal worth acting on.
- Connect it to your goals: If you've mapped out specific financial goals, your dashboard is how you track progress toward them. The complete guide to monitoring financial goals explains how to set milestones and measure movement.
- Adjust your plan when needed: If your net savings rate drops two months in a row, use that signal to revisit your budget - not to panic. The dashboard gives you early warning, which is far better than a late surprise.
Name Your Monthly Review Session
Give your monthly check-in a consistent name - some people call it a 'money date' - and treat it like any other appointment. Doing it at the same time each month (say, the first Sunday evening) makes it a habit rather than a chore. Pair it with something you enjoy, like a favourite drink or snack, to make it feel less like a task.
Keeping It Simple and Sustainable
The most common mistake beginners make is overbuilding their dashboard. Fifteen metrics, colour-coded tabs, and automated data feeds sound impressive - but if the system is too complex to maintain, it will be abandoned within weeks.
Start with just the five data points described above. Add complexity only when you have a clear reason to. A dashboard you update every month for two years will do far more for your financial progress than a sophisticated one you give up on after two weeks.
If you haven't yet defined what you're tracking toward, begin with your goals first. Our starter map for first financial goals helps you name and prioritise what matters most before building your tracking system around it.
Building financial awareness is a skill - and like any skill, it improves with practice. Your dashboard is the feedback loop that makes that practice measurable.
This article is for informational and educational purposes only. It does not constitute personalised financial, investment, or tax advice. Consult a qualified financial professional for guidance specific to your circumstances.